Internet line
External connections are checked continuously to record outages and build evidence for provider complaints.

Managed IT services
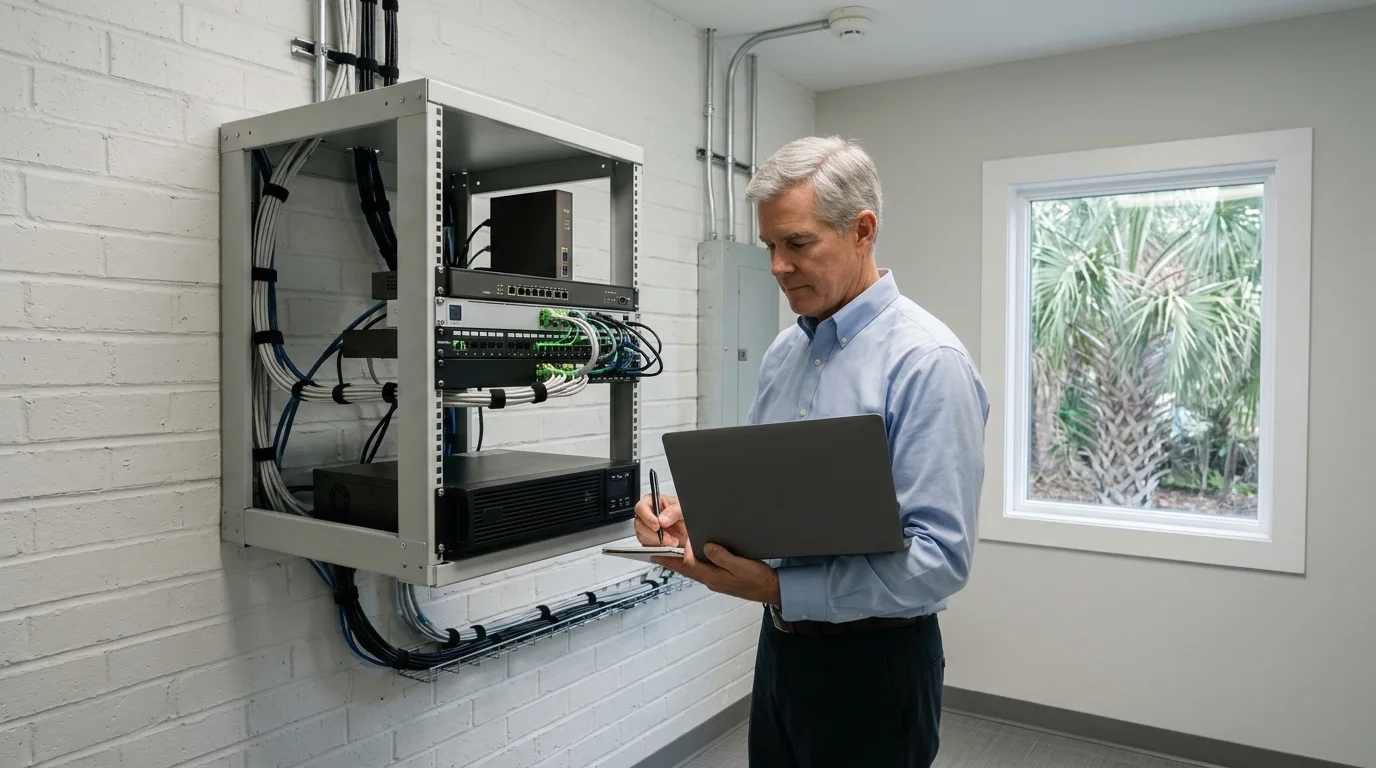
Your internet line, firewall, switches, Wi-Fi and servers are watched continuously, and an alert reaches a person if a connection drops.
Outages affect staff and customers. Network monitoring checks your equipment continuously for availability and performance. You know about a problem early and can see for yourself that everything is fine.
Watched continuously
See what support sees
Customers see the same network monitoring dashboard that our support team uses. Outages and slowdowns raise an alert and a ticket, while monitoring history records how often and for how long a connection dropped.
Management and colleagues view the same live network status as the support team, accessible via a secure URL.
Outages and slowdowns raise an alert and a ticket. Notifications reach our team through email, SMS, push notifications or Teams messages.
Monitoring history records how often and for how long a connection dropped. Evidence is gathered automatically to support a complaint with your internet provider.
Custom maps and dashboards display live status with clear color coding. Over 300 widgets build visual layouts ranging from device icons to traffic charts and toplists.
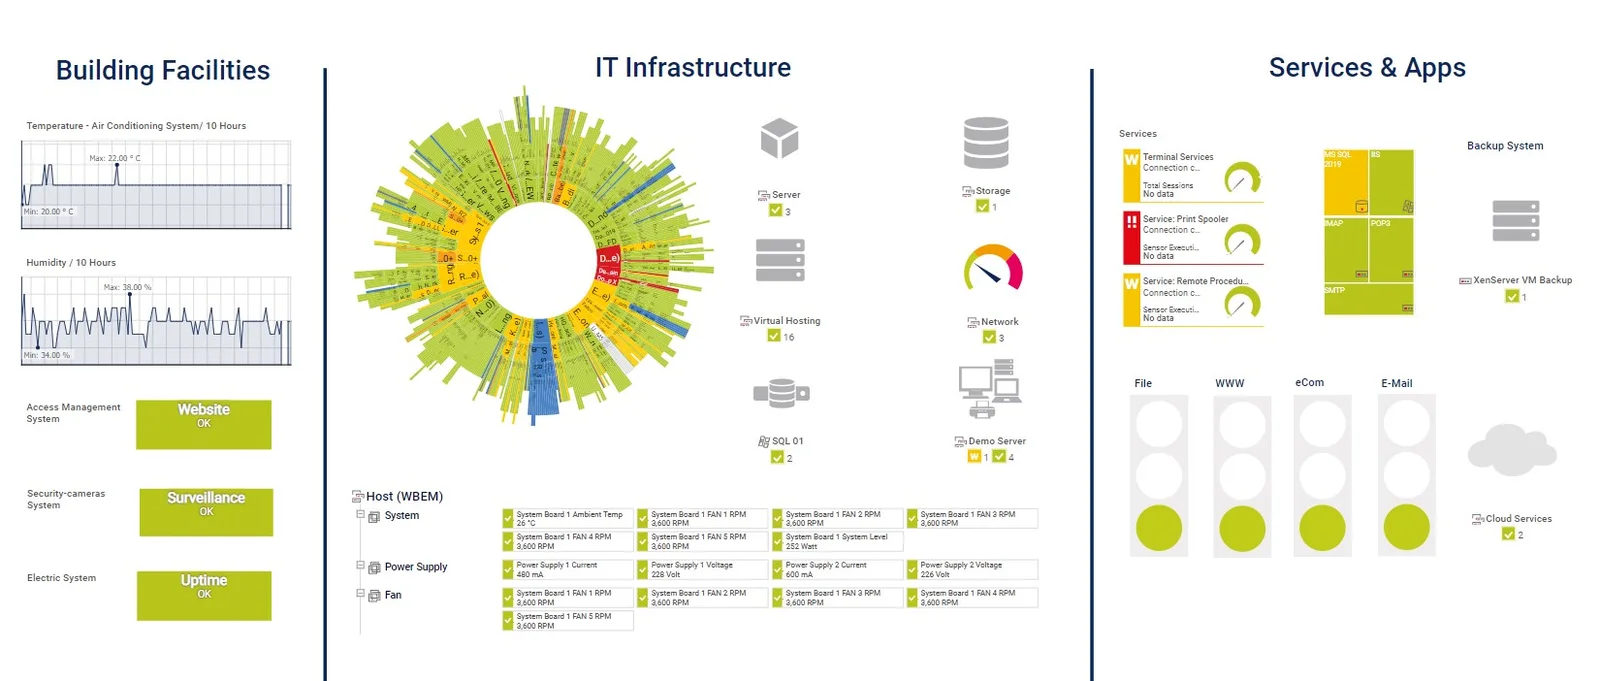
Screens shown are Paessler PRTG example dashboards, not a real customer network.
Monitoring your internet connection separately from the firewall shows whether an outage is the provider line or your own office equipment. Traffic history reveals which devices or applications use the bandwidth.
Select a network problem
Monitoring shows
Meaning
Next
Readings shown are examples to demonstrate issue isolation.
PRTG monitors servers, network devices, traffic, applications, cloud services and operational technology from one centralized system. Everything on your network is watched.
External connections are checked continuously to record outages and build evidence for provider complaints.
Edge security appliances are monitored to confirm they route traffic and remain online.
Core network switches are watched to ensure wired devices stay connected and functional.
Wireless units are checked continuously to verify availability and performance across the network.
Hardware availability is monitored constantly to confirm servers are powered on and active.
A database query confirms the application is answering, utilizing SQL, a standard query language.
Status and health are read over SNMP, the standard management protocol, to monitor office devices.
Traffic flows are measured to find which devices or applications use the bandwidth capacity.
Custom sensors and the API allow PRTG to monitor devices that have no built-in sensor.
Operational technology and external cloud platforms are watched from the same central system.
Equipment is mapped and added to the system. Alert thresholds are set individually to fit the need, catching issues before they become full outages.
Every device on your network is identified, mapping the full infrastructure from the internet line to individual access points.
Equipment is entered into PRTG to begin active monitoring of availability and performance metrics.
Warning and error limits are fine-tuned for each piece of equipment. Slowdowns raise an alert based on custom response times or bandwidth limits.
Escalation paths route notifications to the right people. Alerts can be scheduled so low-priority issues are not sent at night.
Live maps are published to a unique URL. Scheduled reports export as HTML or PDF for technical staff and management.
You have a dashboard showing the exact same view of your network that our support team sees. Dashboards can be shared with colleagues, shown on a screen, or made public.
Monitoring the internet connection separately from the firewall shows whether an outage is the provider's line or your own office equipment.
Your internet connection, firewall, switches, Wi-Fi and servers are checked continuously. PRTG also monitors traffic, applications, cloud services, operational technology, printers and battery backups.
Notifications reach your device through SMS or push notifications via the free PRTG apps for iOS and Android. Email, Teams or Slack messages are also available.
A threshold can be set on response time or bandwidth, so a slowdown raises an alert, not only a full outage. Warning thresholds catch issues early.
Monitoring history shows how often and for how long a connection dropped. Evidence is recorded automatically, giving you the facts needed when raising a complaint.
Prices are not stated here. Call us at (844) 422-7000 to discuss your equipment and receive an accurate quote for monitoring your network.
Call (844) 422-7000 or book a walkthrough to discuss your equipment.